If your website takes forever to load, feels sluggish when people try to click stuff, or has elements jumping around like they’ve had too much coffee, you’ve got a Core Web Vitals problem. And yeah, Google is watching.
Core Web Vitals are Google’s way of measuring how your website actually feels to real people. Not how it looks in a design mockup, not how clever the code is under the hood, but how it performs in the wild when someone pulls it up on their phone during a lunch break. And since 2021, these metrics have been a confirmed Google ranking factor. So ignoring them? Not really an option anymore.
Whether you’re a business owner wondering why your site isn’t ranking, a developer trying to squeeze out every last millisecond, or just someone who’s curious about what those weird scores in PageSpeed Insights actually mean, this guide breaks down Core Web Vitals in plain English. We’ll cover what each metric measures, why it matters, and most importantly, how to actually fix the stuff that’s dragging your scores down.
Let’s get into it.
What Are Core Web Vitals
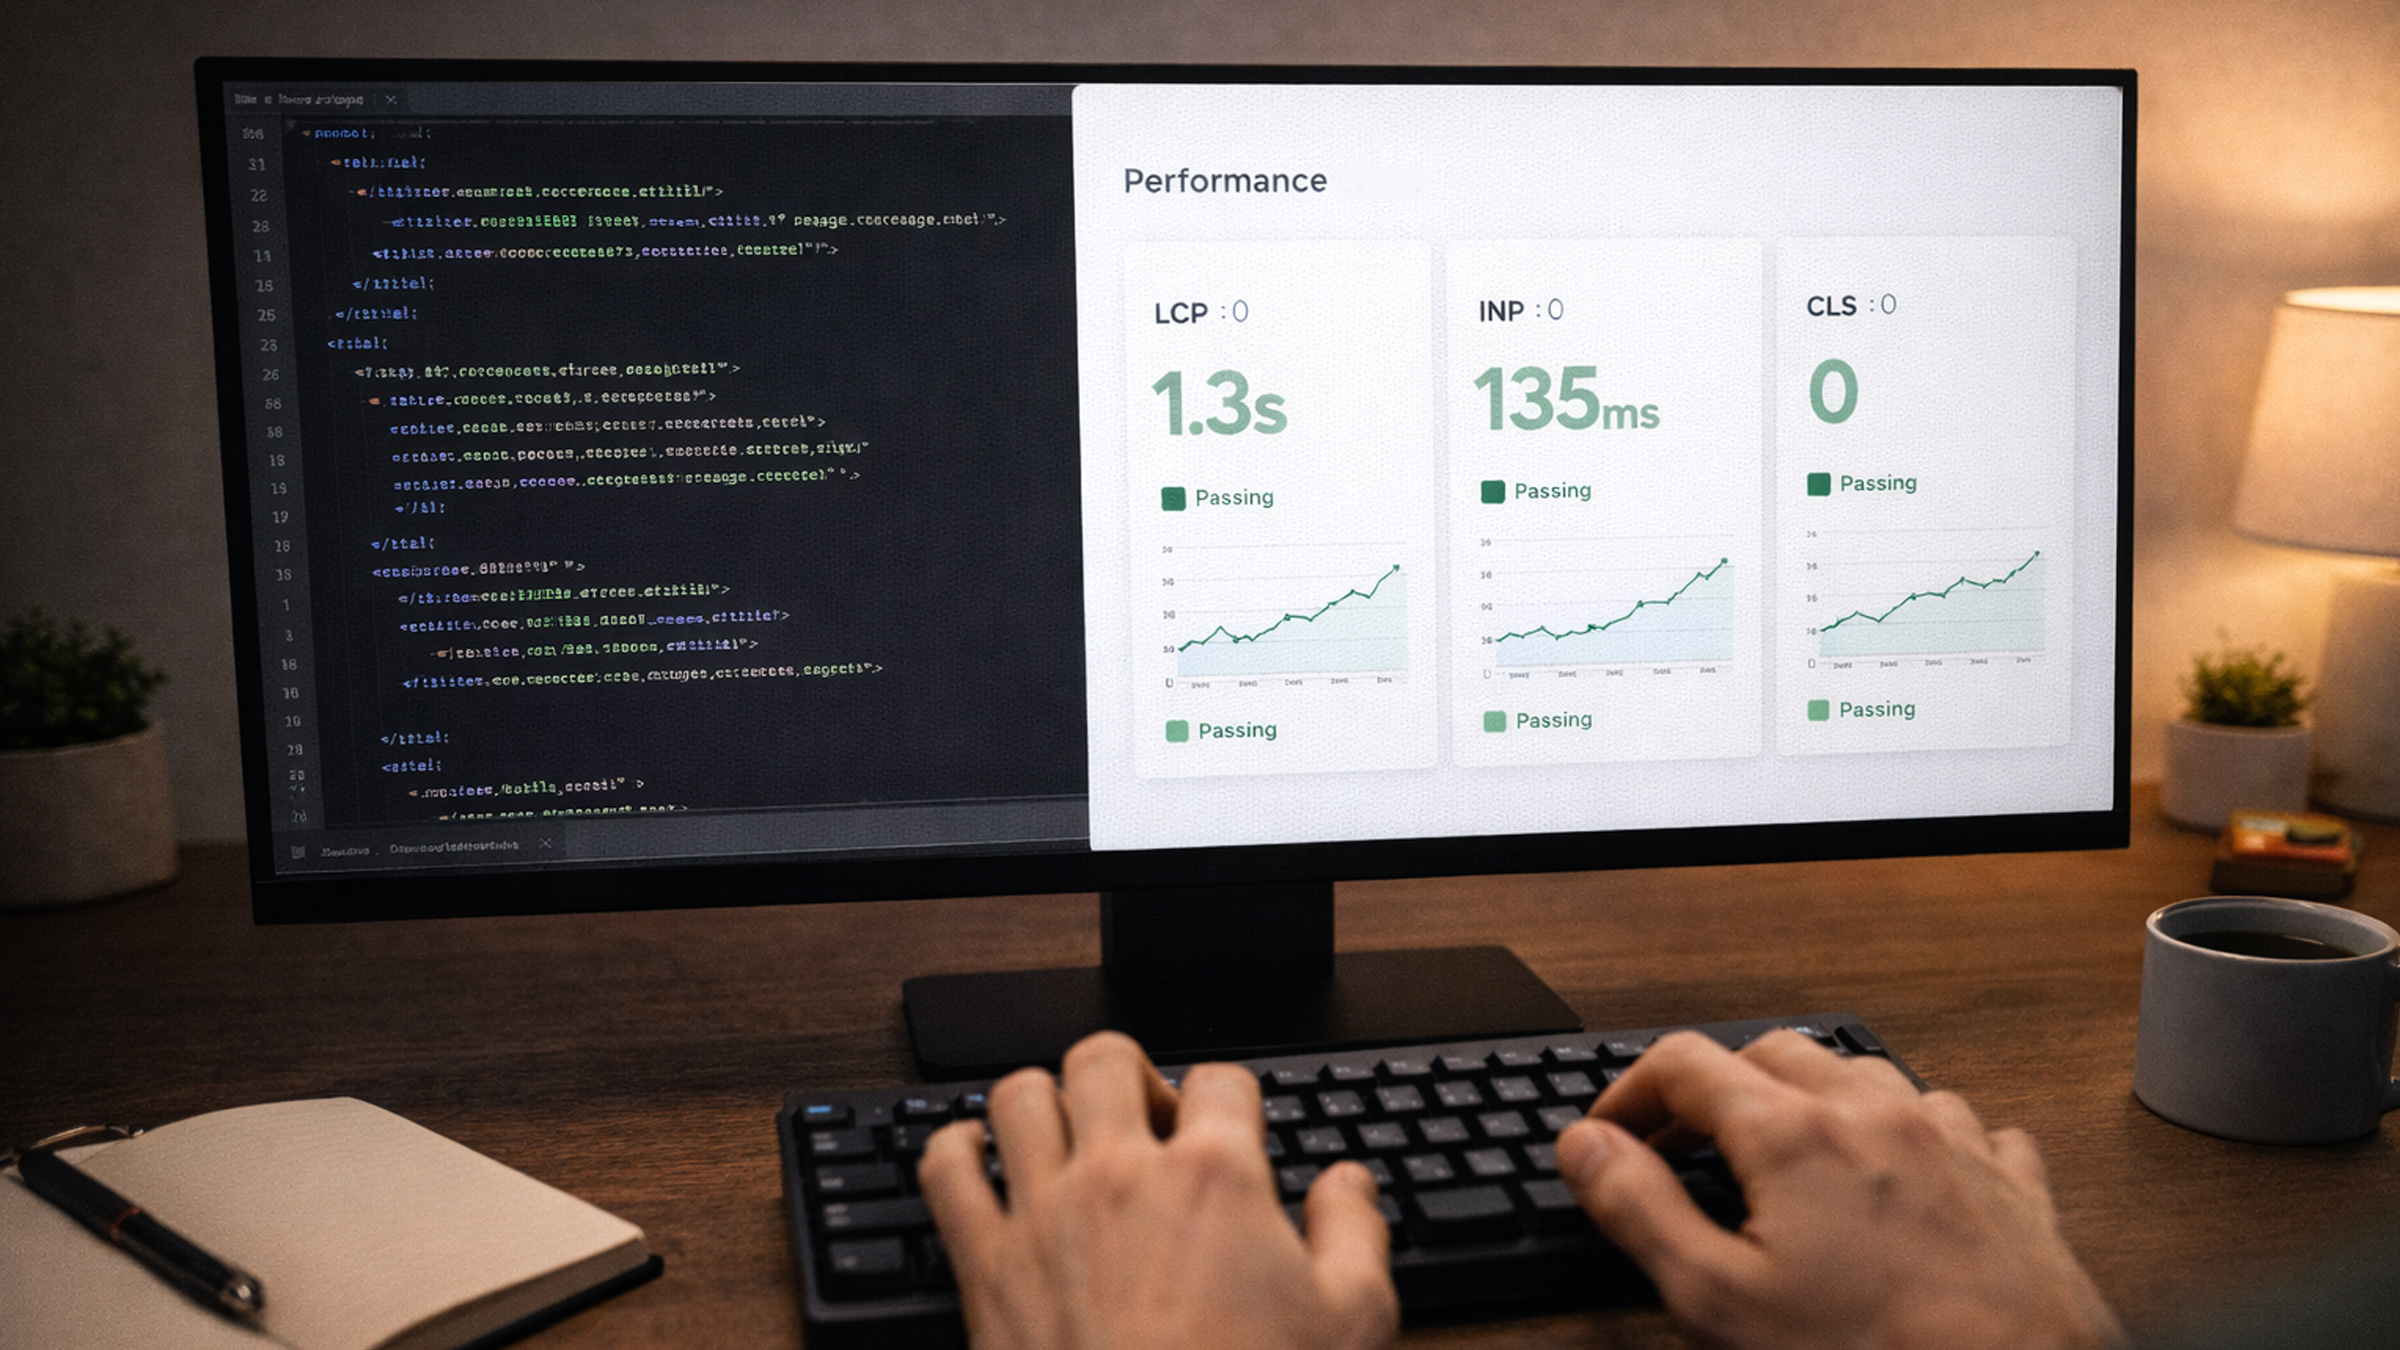
Core Web Vitals are a set of three specific metrics that Google uses to evaluate the user experience of a web page. They zero in on three things that matter most: loading performance, interactivity, and visual stability.
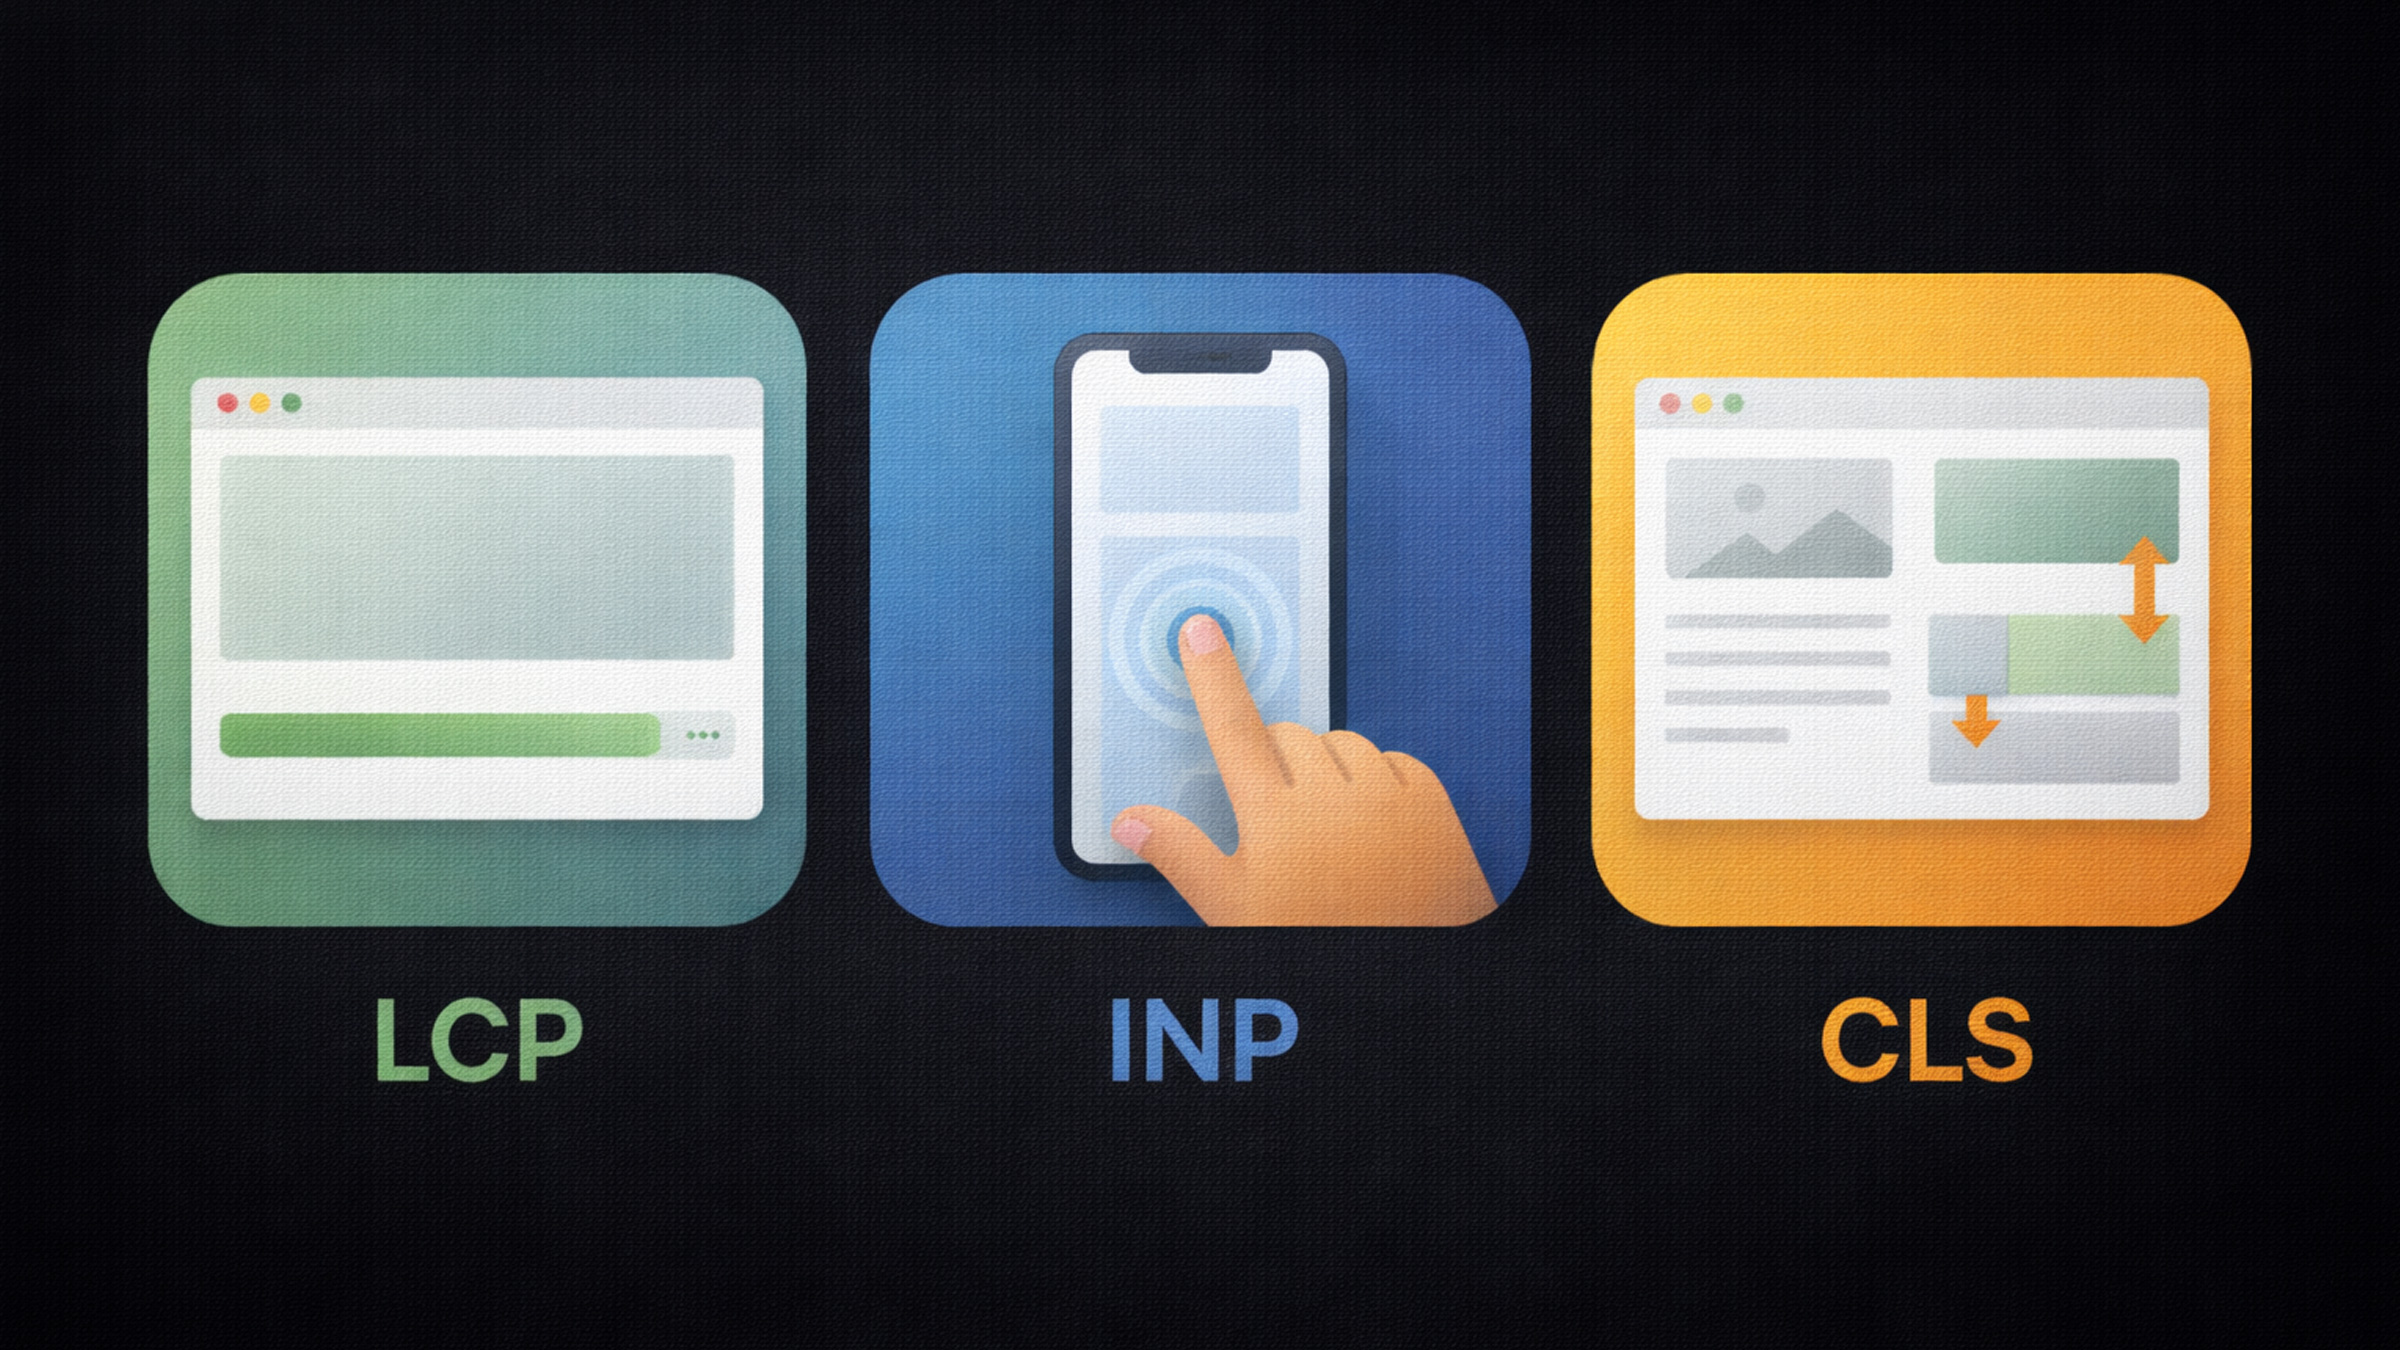
Here’s the lineup:
- LCP (Largest Contentful Paint) measures how fast the main content of your page loads
- INP (Interaction to Next Paint) measures how quickly your page responds when someone interacts with it
- CLS (Cumulative Layout Shift) measures how much stuff unexpectedly moves around on the screen
Google introduced these metrics as part of their broader page experience signals, and they’ve been refining them ever since. The biggest recent change? In March 2024, INP officially replaced FID (First Input Delay) as the responsiveness metric. If you’re still optimizing for FID, you’re a bit behind, just saying.
These metrics are collected from real users through the Chrome User Experience Report (CrUX), which means Google isn’t just running lab tests on your site. They’re measuring how it actually performs for people visiting it out in the real world. That’s both exciting and slightly terrifying.
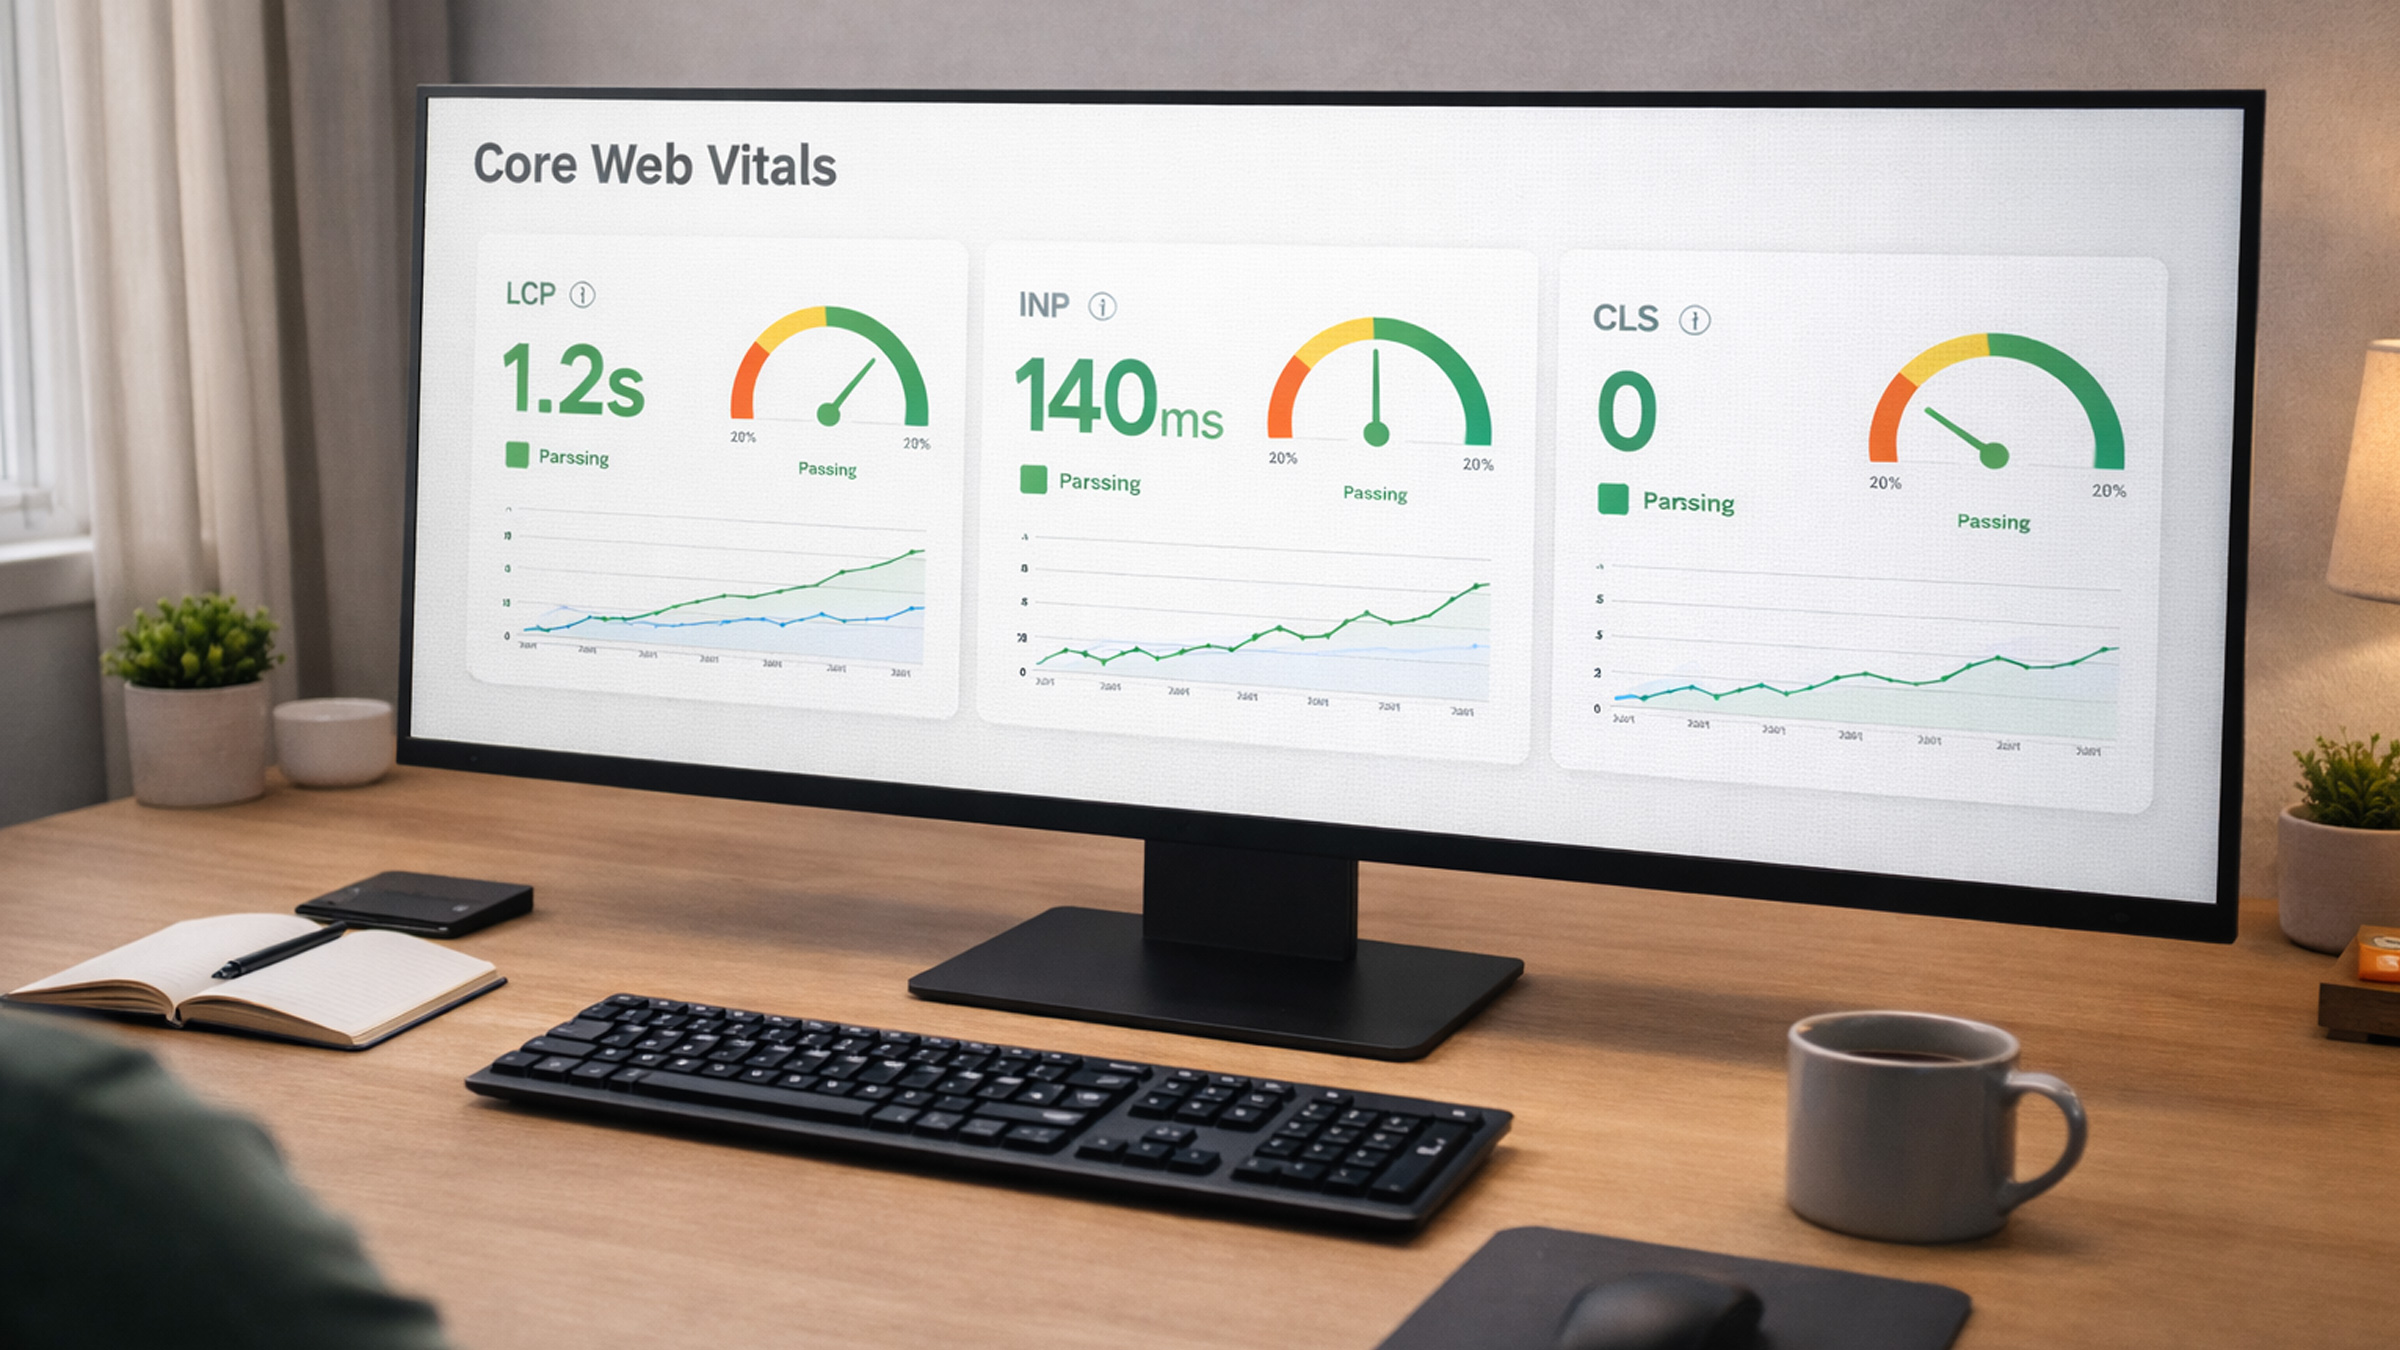
The thresholds Google considers “good”:
- LCP: 2.5 seconds or less
- INP: 200 milliseconds or less
- CLS: 0.1 or less
If you’re hitting those numbers for at least 75% of your page visits, Google considers your Core Web Vitals as passing. Anything worse and you’re leaving both rankings and user satisfaction on the table.
LCP: Largest Contentful Paint
LCP measures how long it takes for the largest piece of visible content to show up on the screen. This is usually a hero image, a big heading, a large text block, or a video thumbnail, basically whatever takes up the most visual real estate above the fold.
Why does this one matter so much? Because LCP is the closest thing we have to measuring what a real person perceives as “the page is loaded.” Nobody cares about your DOM content loaded event or your time to first byte in isolation. They care about seeing actual content. LCP captures that moment.
Google’s own LCP documentation goes deep into the technical details, but here’s the practical breakdown.
What usually causes bad LCP:
- Slow server response times (your TTFB is dragging everything down)
- Render-blocking JavaScript and CSS files
- Unoptimized images, massive file sizes, no modern formats
- Client-side rendering that delays actual content from appearing
- Lazy loading your hero image (seriously, don’t do this)
How to improve it:
- Optimize your server response time. If your TTFB is over 600ms, start there. Use a CDN, enable caching, and consider upgrading your hosting.
- Preload critical assets. Use
<link rel="preload">for your hero image and critical fonts so the browser grabs them immediately. - Use modern image formats. AVIF and WebP are significantly smaller than JPEG and PNG at the same visual quality. Your LCP image should absolutely be in one of these formats.
- Don’t lazy load above-the-fold images. Your hero image should load right away, not wait for a scroll event that hasn’t happened yet. This is one of the most common mistakes out there.
- Minimize render-blocking resources. Inline critical CSS, defer non-essential JavaScript, and keep the critical rendering path as lean as possible.
A good LCP is 2.5 seconds or under. Between 2.5 and 4 seconds needs improvement. Over 4 seconds? That’s a red flag, and Google treats it like one.
INP: Interaction to Next Paint
INP is the newest metric in the Core Web Vitals lineup, and it’s kind of a big deal. It replaced First Input Delay (FID) in March 2024 because FID only measured the delay of the first interaction, which honestly didn’t tell the whole story. INP measures the responsiveness of all interactions throughout the entire page visit, then reports the worst one (roughly speaking).
In plain English: when someone taps a button, clicks a link, or types in a field, how long does it take for the page to visually respond? That’s INP.
What causes bad INP:
- Heavy JavaScript execution blocking the main thread
- Long tasks (anything over 50ms is considered a long task by Chrome)
- Expensive event handlers that do way too much work when a user interacts
- Third-party scripts, think analytics, ads, chat widgets, all fighting for CPU time
- Complex DOM structures that take forever to update after an interaction
How to improve it:
- Break up long tasks. Use
setTimeout,requestAnimationFrame, or thescheduler.yield()API to split heavy work into smaller chunks so the browser can respond to user input between them. - Reduce your JavaScript bundle size. Less JavaScript means less to parse and execute. Code splitting and tree shaking are your best friends here.
- Debounce event handlers. If you have scroll or input handlers firing constantly, debounce them so they’re not running on every single event.
- Audit third-party scripts ruthlessly. That chat widget or social embed might be adding 200ms to your interaction delay. Is it worth the trade-off?
- Use web workers for heavy computation. Offload non-UI work to a web worker so it doesn’t block the main thread.
INP is where a lot of sites struggle the most right now, because it exposes performance problems that were always there but that FID never captured. If your site feels sluggish when people interact with it, INP is probably telling you exactly why.
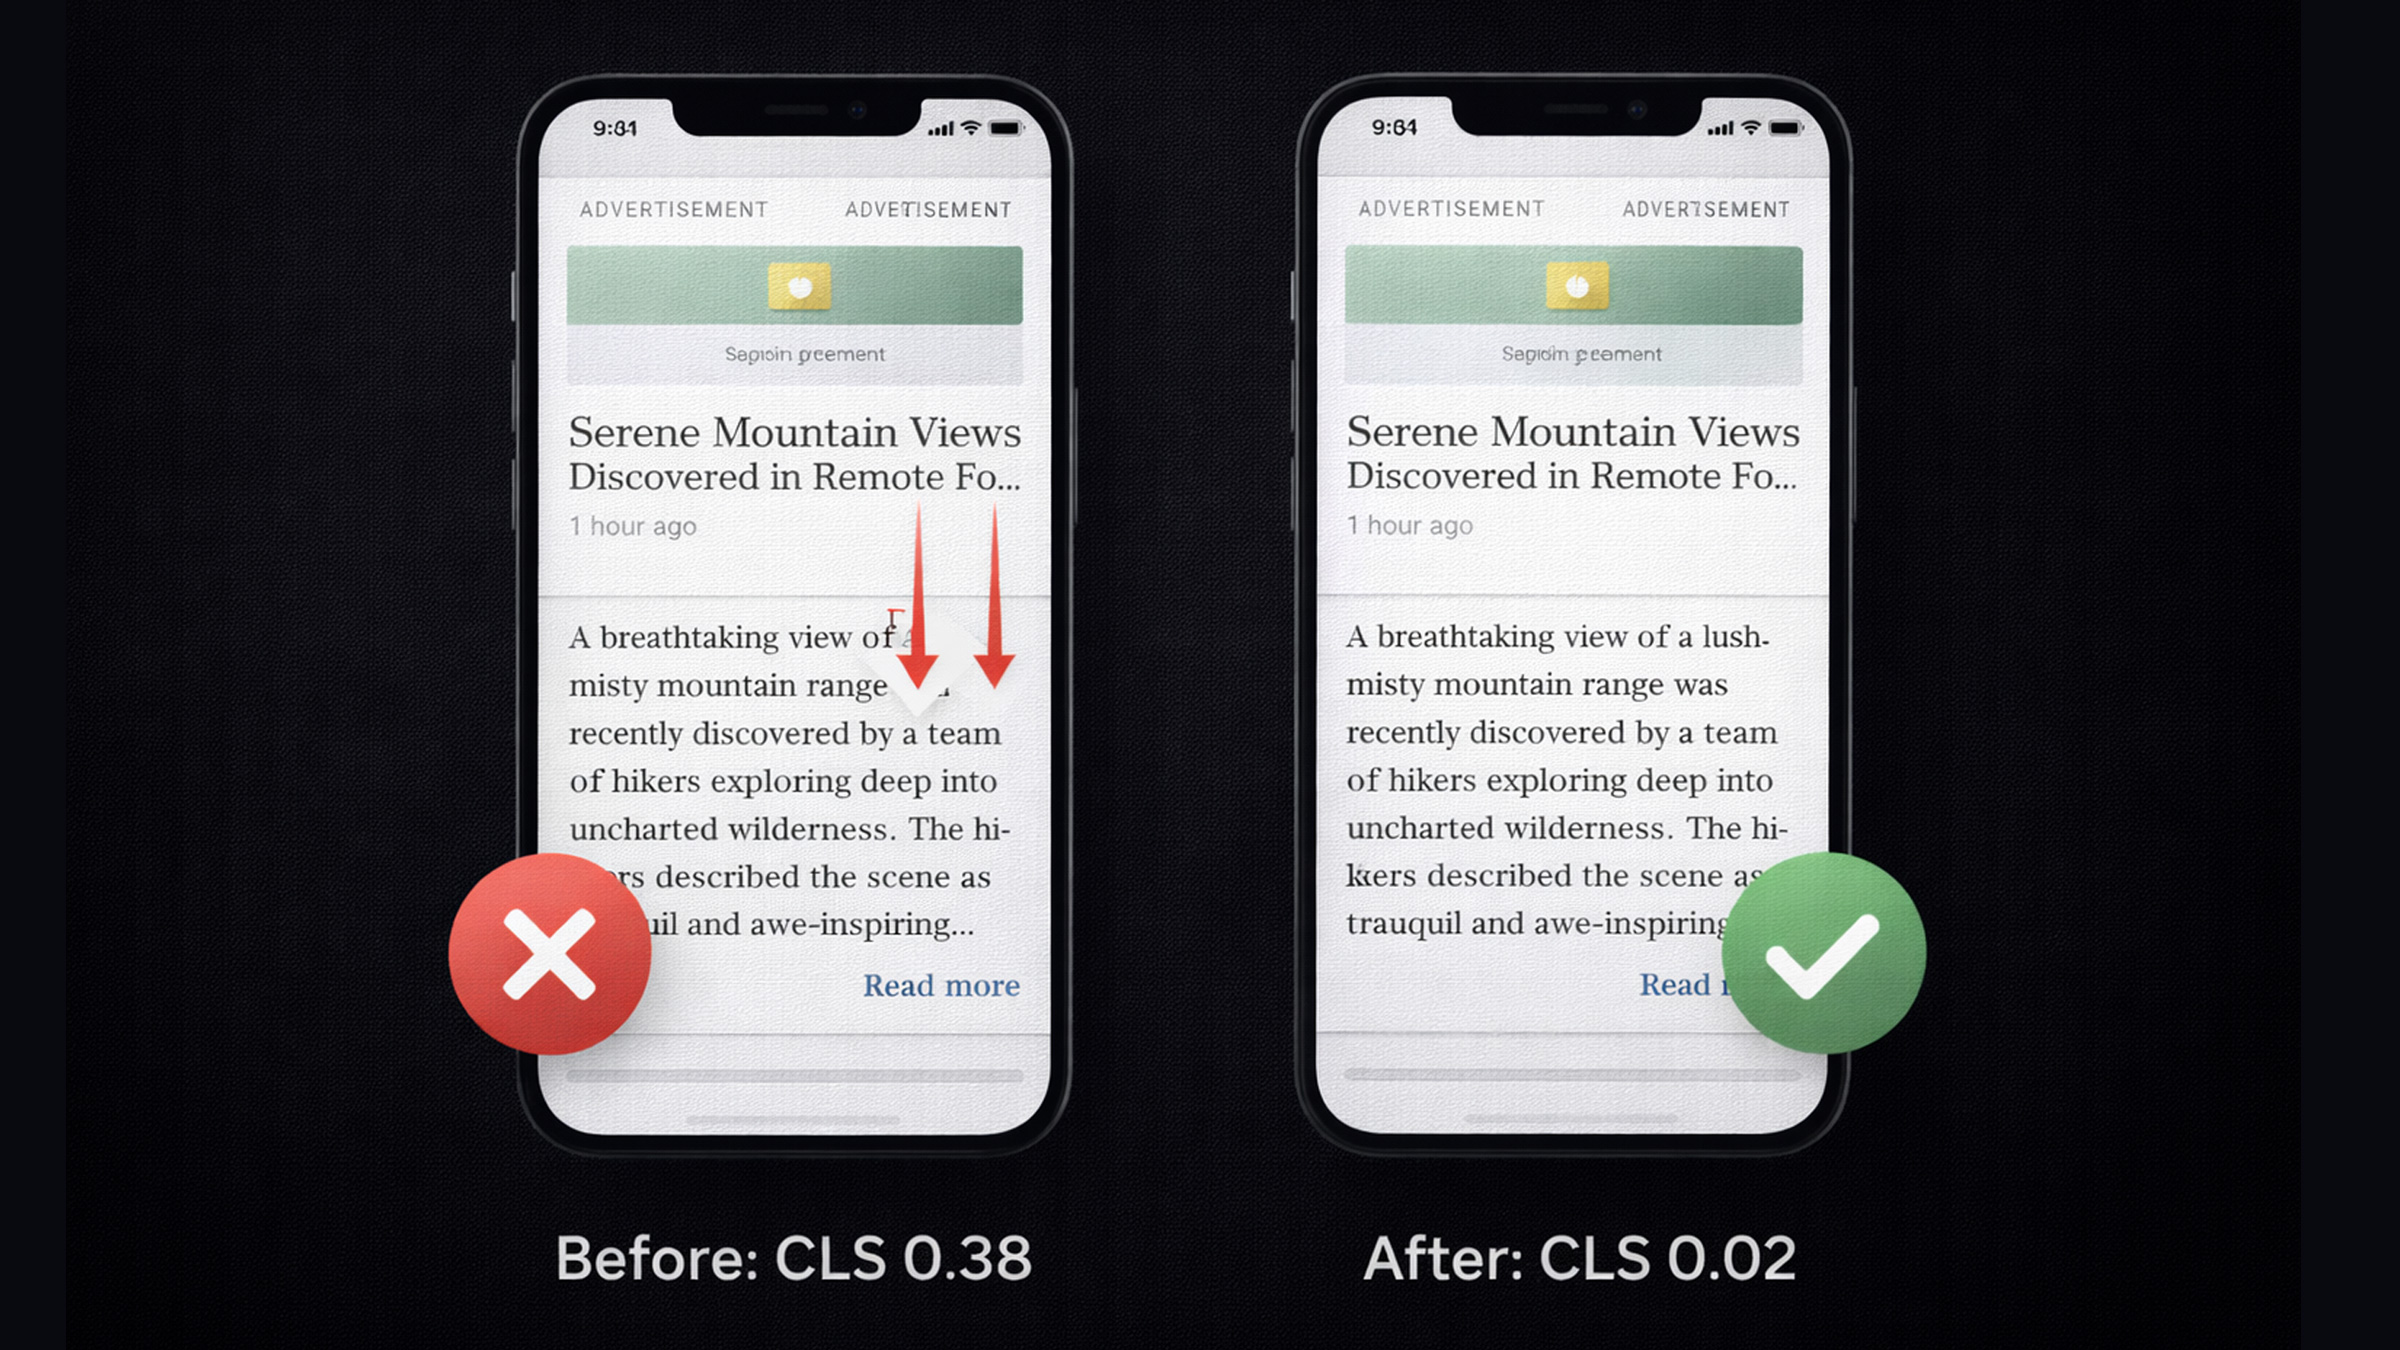
CLS: Cumulative Layout Shift
CLS measures visual stability, specifically, how much content unexpectedly shifts around while the page is loading. You know that infuriating experience where you’re about to tap a link and the page suddenly jumps because an ad or image loaded above it? That’s a layout shift, and CLS quantifies exactly how bad it is.
The most common culprits behind bad CLS:
- Images and videos without explicit width and height dimensions
- Ads, embeds, or iframes that load without any reserved space
- Dynamically injected content that pushes existing content down the page
- Web fonts causing a flash of invisible text (FOIT) or flash of unstyled text (FOUT)
- Late-loading banners or cookie consent bars that shove everything downward
How to improve it:
- Always set width and height on images and videos. Or use the CSS
aspect-ratioproperty. This lets the browser reserve the right amount of space before the asset actually loads. - Reserve space for ads and embeds. Use a container with a fixed minimum height so content below doesn’t jump when the ad finally shows up.
- Use
font-display: swapwith font preloading. This prevents invisible text and reduces the layout shift when custom fonts kick in. - Avoid inserting content above existing content. If you need to add a banner or notification, use a sticky or fixed position, or insert it below the fold.
- Use the CSS
containproperty where appropriate. It tells the browser that certain elements won’t affect the layout of their siblings, which helps prevent unexpected shifts.
CLS is sneaky because it’s often perfectly fine during development but terrible in the real world where connections are slower and resources load at unpredictable times. Always test on real devices with throttled connections, not just your MacBook on fiber internet.
How Core Web Vitals Affect Your SEO
Alright, let’s get to the part everyone’s really curious about: how much do Core Web Vitals actually matter for SEO?
Google has been pretty upfront about this. Core Web Vitals are a confirmed ranking signal as part of their page experience update. But here’s the nuance that a lot of people miss: they’re not the most important ranking factor. Relevant, high-quality content still wins. If your article is the best answer to someone’s search query, it can rank well even with mediocre Core Web Vitals.
But here’s the thing, all else being equal, the site with better Core Web Vitals gets the edge. Think of it like a tiebreaker. If two pages have equally great content, Google is going to prefer the one that loads faster, responds quicker, and doesn’t have stuff jumping around.
And beyond direct rankings, Core Web Vitals have a massive indirect impact through user behavior signals:
- Faster pages have lower bounce rates
- Better interactivity keeps people engaged longer
- Stable layouts reduce frustration and increase conversions
Google Search Console has a dedicated Core Web Vitals report that tells you exactly which pages are passing and which ones need work. If you’re serious about SEO, you should be checking this regularly.
One more thing worth knowing: Google evaluates Core Web Vitals at the page level and groups similar pages together. So if your blog posts all share the same template and one of them has bad CWV, the others probably do too. Fix the template, fix them all. This is also why modern web design trends are increasingly built around performance from the ground up.
How to Measure Your Core Web Vitals
You can’t improve what you don’t measure. Luckily, Google gives you a bunch of free tools to check your Core Web Vitals. Here are the ones you should actually know about:
PageSpeed Insights
PageSpeed Insights is the go-to tool for most people. Plug in any URL and get both lab data (simulated tests) and field data (real users) for all three Core Web Vitals. It also gives you specific recommendations for what to fix, prioritized by impact. Start here.
Google Search Console
The Core Web Vitals report in Search Console shows you which pages on your entire site are good, need improvement, or poor. This is the bird’s-eye view you need for monitoring trends over time and catching regressions before they tank your rankings.
Chrome DevTools (Lighthouse)
Built right into Chrome, Lighthouse runs a lab audit on your page and gives you performance scores along with actionable suggestions. Super helpful for debugging specific issues during development when you need to test changes in real time.
Chrome User Experience Report (CrUX)
CrUX is the dataset of real-user metrics that Google actually uses for ranking purposes. You can access it through PageSpeed Insights, the CrUX Dashboard, or the CrUX API. This is the ground truth, what Google is literally looking at when it evaluates your site.
Web Vitals JavaScript Library
If you want to track Core Web Vitals in your own analytics, Google’s open-source web-vitals library makes it super easy. A few lines of code and you’re measuring all three metrics from your actual visitors.
Pro tip: don’t just test on your shiny MacBook with a fiber connection. The real test is on a mid-range Android phone on a 4G connection. That’s where most of the world actually browses, and that’s what Google cares about.

Quick Wins to Improve Your Scores
If your Core Web Vitals scores are looking rough and you need to make progress fast, here are some quick wins that tend to have the biggest bang for your buck:
- Compress and convert your images. Switch to WebP or AVIF, resize to the actual display size, and compress aggressively. This alone can shave seconds off your LCP.
- Add explicit dimensions to all images and videos. Width and height attributes or CSS
aspect-ratio. This is hands down the fastest single fix for CLS issues. - Defer non-critical JavaScript. Add
deferorasyncto script tags that don’t need to run immediately. Move third-party scripts below the fold. - Preload your LCP image. One line in your
<head>:<link rel="preload" as="image" href="your-hero.webp">. That’s it. - Use a CDN. Serving static assets from edge servers close to your users dramatically reduces TTFB and improves LCP across the board.
- Audit your third-party scripts. Remove anything you’re not actively using. That old analytics tag, that social widget nobody clicks, that A/B testing script from two years ago, just get rid of them.
- Enable browser caching. Set proper
Cache-Controlheaders so returning visitors don’t have to re-download everything from scratch. - Minimize font loading impact. Preload critical fonts, use
font-display: swap, and consider cutting the number of font weights you’re loading.
The beautiful thing about Core Web Vitals is that small changes add up fast. You don’t always need a massive overhaul. Sometimes it’s just a handful of targeted fixes that take your scores from red to green.
If performance optimization feels overwhelming, or you just want someone to handle it properly, that’s literally what we do. We build websites with Core Web Vitals baked in from day one so you’re not scrambling to fix things after launch.
Frequently Asked Questions
What are Core Web Vitals?
Core Web Vitals are three specific metrics Google uses to measure user experience: LCP (loading speed), INP (interactivity), and CLS (visual stability). They’re part of Google’s page experience ranking signals and directly influence how your site performs in search results.
Do Core Web Vitals affect SEO rankings?
Yes. Core Web Vitals are a confirmed Google ranking factor. While content quality is still the primary signal, better Core Web Vitals can give you an edge over competitors with similar content. Think of it as the tiebreaker.
What replaced First Input Delay (FID)?
Interaction to Next Paint (INP) replaced FID in March 2024. Unlike FID, which only measured the delay of the first interaction, INP measures responsiveness across all interactions during a page visit, giving a much more complete picture of how your site actually feels to use.
What’s a good LCP score?
Google considers an LCP of 2.5 seconds or less as “good.” Between 2.5 and 4 seconds needs improvement, and over 4 seconds is classified as poor. For most sites, optimizing images and server response time are the fastest ways to improve LCP.
How often should I check my Core Web Vitals?
At minimum, once a month. If you’re actively making performance changes, check weekly. Google Search Console’s Core Web Vitals report is the best tool for ongoing monitoring since it tracks real user data over time and flags regressions automatically.